How to Measure Organic Growth When AI Overviews Reduce Clicks (2026–2027 KPI Playbook)
If Search Console impressions are rising while GA4 organic sessions are falling, the problem may not be your dashboard. It may be the way you interpret it.
For years, organic reporting followed a simple chain: rankings led to clicks, clicks led to sessions, and sessions led to conversions. That still holds for some commercial queries. But it breaks when search results answer more of the question before anyone visits your site, which is happening more often in AI Overviews and similar search features.[^1][^2]
The issue is not only lower CTR. It is distorted measurement. Some of the value organic search used to produce as a visible visit may now show up later as a branded search, a direct return, a signup, a trial, or a demo request. That does not mean organic is performing well by default. It means you need a better way to tell attribution loss from actual demand loss.
Why organic reporting breaks when AI Overviews reduce clicks
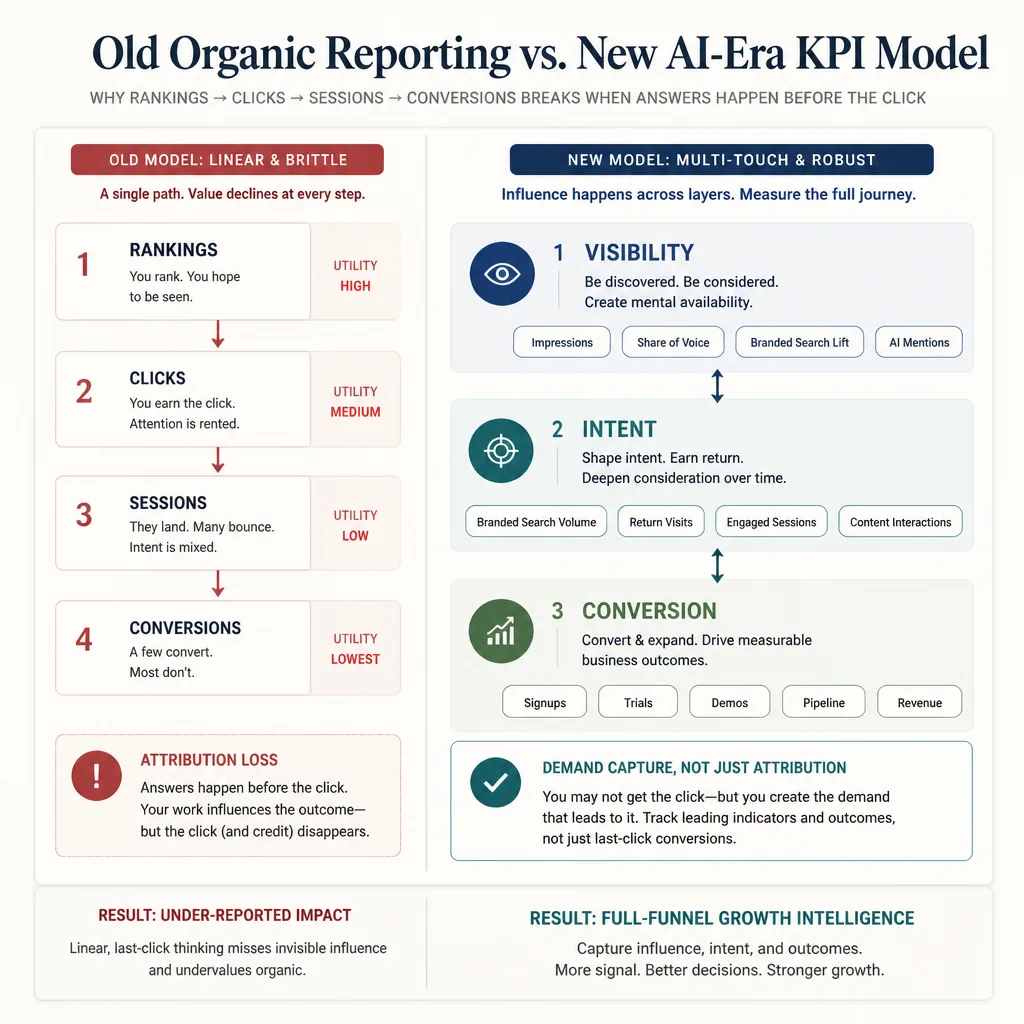
The old model: rankings → clicks → sessions → conversions
Traditional SEO reporting assumed most organic value appeared in the clickstream. If rankings improved, clicks should rise. If clicks rose, sessions should follow. If the page worked, conversions should improve.
That model was never perfect, but it was clear enough for leadership because the path was visible.
What changes in AI-first SERPs
Google now treats generative search visibility as its own reporting layer in Search Console, with reporting for impressions in features such as AI Overviews and AI Mode.[^1][^2] That formalizes something many teams are already seeing: your brand can appear in search without the interaction turning into a traditional website visit.
Search Console still reports familiar metrics like impressions and clicks, but those metrics were designed to measure link visibility and interaction, not full business impact.[^3][^4] In other words, more of the interaction can happen on the search results page itself.
Why impressions may rise while clicks fall
A few patterns show up often:
- Your pages appear more often in AI-shaped results, so visibility increases.
- Fewer users need to click because Google answers part of the question first.
- The people who still click may be more qualified because casual visitors drop off earlier.
Google has said that clicks from AI search experiences can be higher quality and that users are asking more complex questions in Search.[^5] That is useful as directional evidence, not proof of revenue lift. Still, it is enough to justify updating how you report performance.
The real issue: attribution loss vs. demand loss
This is the distinction that matters.
Attribution loss means search still influenced the buyer, but credit leaks elsewhere. The user sees your brand in search, returns later through direct traffic, searches your brand name, signs up from email, or books a demo on a later session.
Demand loss means the visibility created little or no meaningful downstream action.
In a last-click report, those two outcomes can look the same. Both can show fewer organic sessions. Only one means organic is truly weakening.
The new KPI model: measure organic influence, not just visits
A better model has three layers: visibility, intent, and conversion.
Three layers of value
Visibility tells you whether you are showing up. Intent tells you whether that visibility is creating interest. Conversion tells you whether the interest becomes business value.
This sounds simple, but it matters because many teams either stop at impressions or jump straight to last-click revenue and miss everything in between.
Leading indicators
At the visibility layer, track:
- Search Console web impressions
- Generative AI impressions in Search Console, if your property has access[^1][^2]
- Query-theme coverage by topic cluster
- Page-group visibility
- Branded search impressions and clicks
Impressions are not a success metric by themselves. They are diagnostic evidence when paired with stronger downstream signals.
Mid-funnel indicators
This is where AI-era SEO becomes more interesting.
For a SaaS company, useful signals often include:
- direct traffic to pricing, product, or comparison pages
- return visits from users first acquired through informational content
- newsletter or lead magnet signups
- free tool usage
- account creation
- trial starts
If a top-of-funnel page loses 30% of its clicks but the same topic cluster generates more return visits and more trial starts over 30 days, that is not a minor detail. It suggests the influence is still there, just less visible on the first session.
Bottom-funnel indicators
For B2B and lead-gen teams, the real scoreboard is farther down the funnel:
- demo requests
- sales-qualified leads
- opportunities created
- pipeline value
- closed-won revenue
The more useful question is: Which landing-page groups and first-touch themes create the strongest downstream cohorts? Not: which page got the most sessions last week?
A practical instrumentation stack for 2026–2027
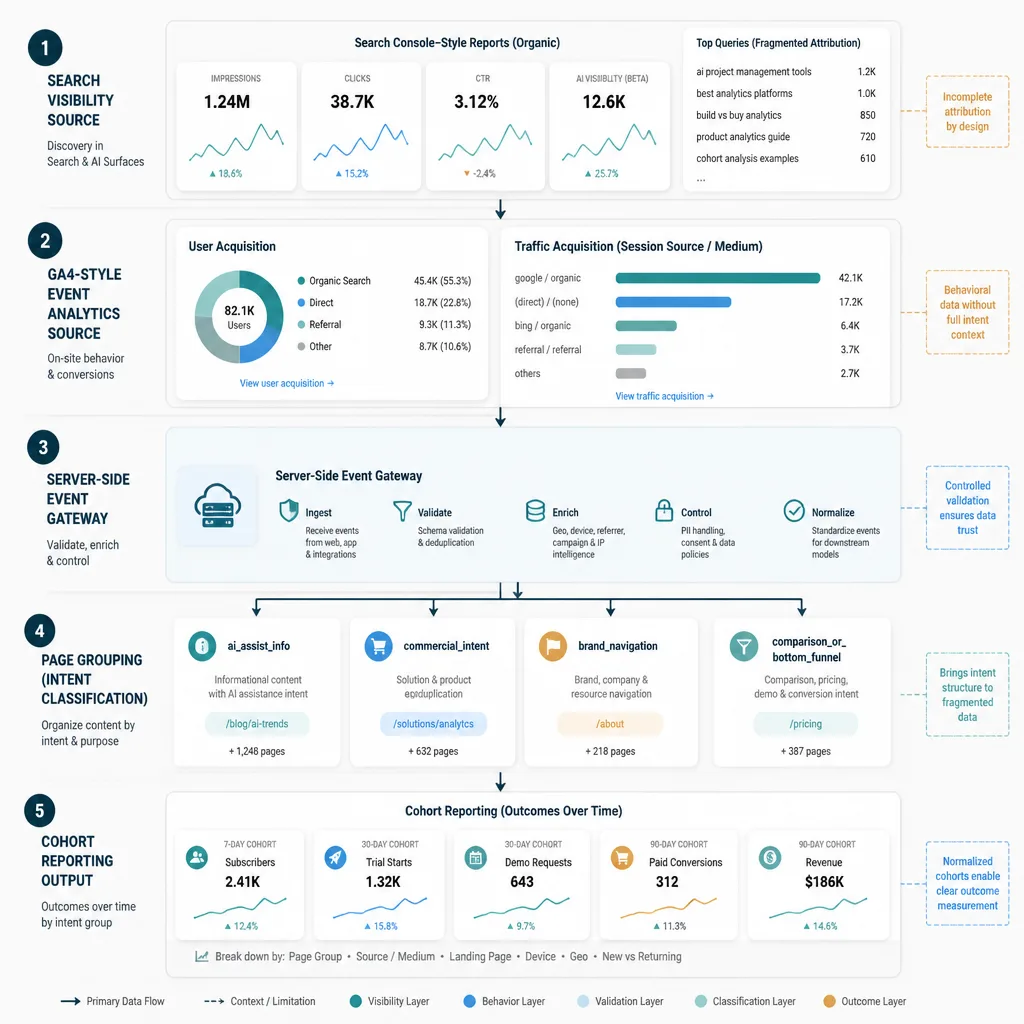
You do not need enterprise attribution software to do this reasonably well.
What GA4 still does well
GA4 is still useful for event-based measurement and acquisition analysis. Its attribution model is designed to assign credit across a path to a meaningful action, not just the final touchpoint.[^6]
Two reports matter most here:
- User acquisition shows how new users first found you.
- Traffic acquisition shows how sessions arrive over time.[^7]
That difference matters. In AI-shaped search, first-touch influence and later-session conversion behavior often separate.
What Search Console adds
GA4 cannot tell you how often your site appeared inside Google’s AI search features. Search Console now can, at least for properties included in the rollout.[^1][^2]
If you have that report, use it.
If you do not, fall back to proxy signals such as:
- page groups tied to informational query themes
- rising impression cohorts
- branded search lift
- return and direct behavior after visibility gains
Why server-side events help
Server-side tagging gives you an endpoint you control between the browser and your analytics tools. Google’s documentation highlights benefits such as screening, validating, and modifying data before it is forwarded, which can improve data quality.[^8]
It will not solve AI attribution on its own. But it does make your event stream more durable when client-side source data is incomplete.
How to define “AI-assist” landing pages
Do not wait for perfect referrer data. You are unlikely to get it.
Instead, create an operational label: AI-assist pages. These are pages likely to influence users in AI-shaped search even when the direct click is missing.
A practical definition includes pages that are:
- informational or problem-aware
- tied to broad query themes with rising impressions
- visible in Search Console’s generative AI report, if available
- losing clicks faster than impressions
In GA4 or your data warehouse, add a page-group dimension such as:
ai_assist_infocommercial_intentbrand_navigationcomparison_or_bottom_funnel
This is not literal source attribution. It is a classification system that helps you make better decisions.
A lean event schema
For most teams, the minimum useful event schema is small:
newsletter_signuplead_magnet_signupaccount_createdtrial_startedpricing_page_viewdemo_request_submittedqualified_leadopportunity_created
GA4 lets you create or modify events and mark them as key events without rebuilding your setup.[^9] Just remember that changes are not retroactive. If you update event definitions, start a fresh baseline instead of pretending the old and new data are directly comparable.[^9]
Build cohort reporting that survives click volatility
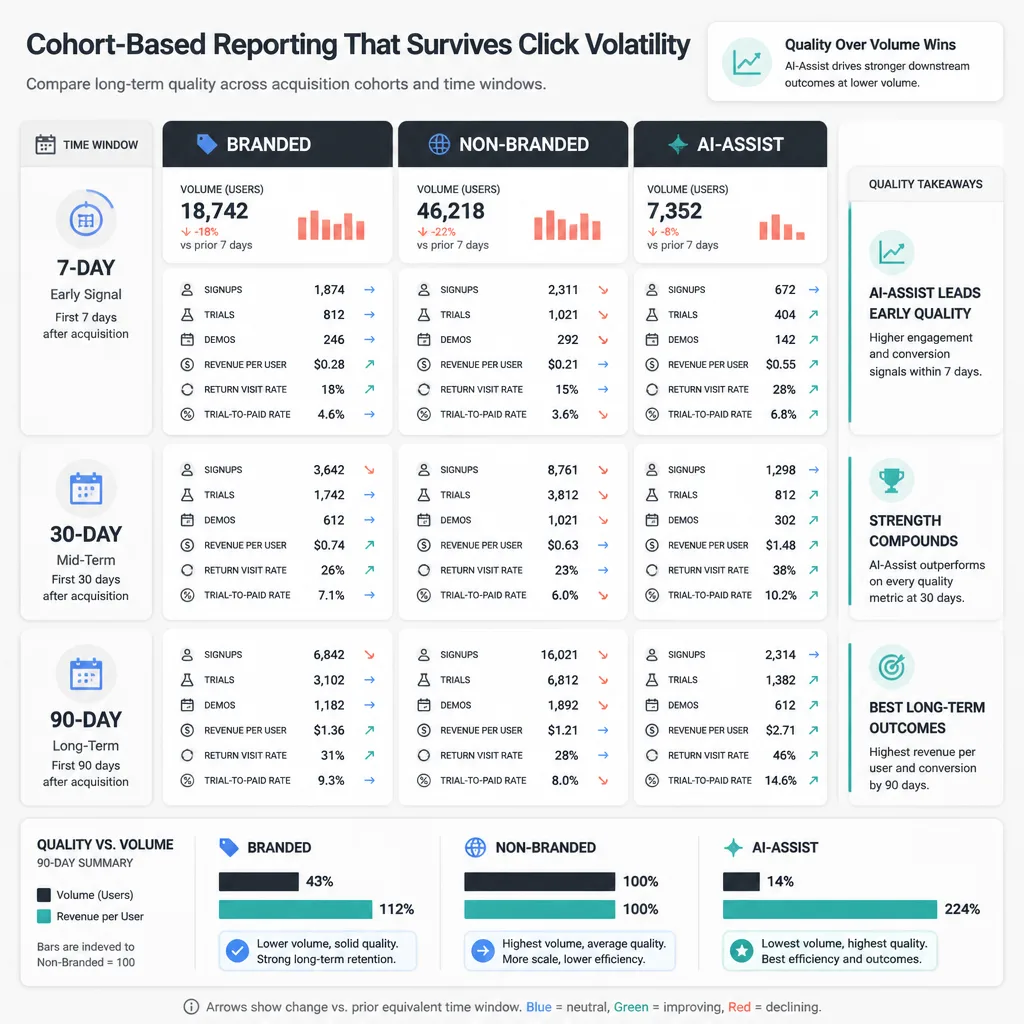
Channel reports get noisy quickly. Cohorts are usually more stable.
Group cohorts by landing page and first-touch theme
At minimum, group users by:
- first landing page group
- branded vs. non-branded first touch
- informational vs. commercial theme
If possible, add topic clusters such as “workflow automation,” “CRM migration,” or “pricing software.”
Use 7-, 30-, and 90-day windows
For SaaS, 7-, 30-, and 90-day windows are often enough to capture both immediate and delayed value.
For example:
- 7-day: signups, pricing page visits, trial starts
- 30-day: trial activation, demo requests, SQLs
- 90-day: opportunities, pipeline, paid conversion
Compare branded, non-branded, and AI-assist cohorts
This is where the picture gets clearer.
A founder should want to know whether users first exposed through ai_assist_info pages behave like casual browsers or serious buyers.
If their 30-day trial-to-demo rate improves while same-session CTR falls, the traffic drop may reflect filtering rather than pure loss.
Focus on cohort quality, not just volume
Volume tells you how much. Quality tells you whether it mattered.
Useful metrics include:
- signup-to-trial rate
- trial-to-paid rate
- demo-to-opportunity rate
- revenue per acquired user
- assisted path length
- return-visit rate
A smaller cohort with stronger downstream conversion can be worth more than a larger, lower-intent one.
A simple model for estimating lost clicks vs. gained intent
Do not overbuild this. Treat it as an operating model, not proof.
Start with expected clicks
Build CTR baselines for page groups or query themes using a pre-change period, such as the previous 8 to 12 weeks or the same season last year.
Expected Clicks = Current Impressions × Historical CTR
Estimate the click gap
Then calculate:
Click Gap = Expected Clicks − Actual Clicks
Example:
- impressions: 120,000
- historical CTR: 2.5%
- expected clicks: 3,000
- actual clicks: 2,100
- click gap: 900
Layer in substitute signals
Now ask whether some of that missing 900 appears elsewhere.
Look for signals like:
- branded search clicks up 12%
- direct visits to pricing up 9%
- newsletter signups from the topic cluster up 18%
- trial starts flat, but trial-to-paid up 14%
- demo conversion rate from remaining organic visitors up 20%
You are not trying to force a 1:1 replacement ratio. You are looking for evidence that some lost clicks turned into better-qualified intent.
How to interpret the pattern
Likely harmful:
- click gap widens
- branded search is flat
- return visits are flat
- subscriber, trial, or demo cohorts weaken
- pipeline contribution falls
Possibly acceptable, even positive:
- click gap widens
- branded search grows
- direct or return visits improve
- conversion efficiency improves
- downstream cohorts strengthen
That still does not prove causation. But it is much more useful than saying, “sessions are down, so SEO is down.”
The weekly dashboard that matters
A useful weekly dashboard has five parts.
Visibility
Track:
- total search impressions
- AI or generative impressions, if available[^1][^2]
- non-brand impression growth
- topic-cluster query coverage
- AI-assist page-group visibility
Intent
Track:
- branded search clicks and impressions
- direct visits to commercial pages
- return visitor growth
- engaged sessions from AI-assist cohorts
- newsletter signups or account creations
Conversion
Track:
- trial starts
- demo requests
- qualified leads
- opportunities created
- organic-influenced pipeline
Quality
Track:
- signup-to-trial rate
- demo-to-opportunity rate
- trial-to-paid rate
- revenue per cohort
- conversion rate by landing-page group
Decision notes
This may be the most useful section.
Every dashboard should end with four short notes:
- What changed
- Most likely cause
- Confidence level
- Next test
That forces interpretation instead of metric theater.
Three experiments to test whether AI visibility helps or cannibalizes revenue
1. AI-assist cohort vs. control cohort
Hypothesis: AI-assist pages lose clicks but still generate stronger assisted intent than a matched control group.
Setup: Compare two page groups over 6 to 8 weeks:
- informational pages with rising impressions and falling CTR
- control pages with similar traffic but lower likelihood of AI exposure
Measure return visits, signups, trials, demos, and pipeline per 1,000 impressions.
Interpretation: If AI-assist pages produce better downstream actions per impression, some value is surviving click compression.
2. Branded search lift after informational visibility gains
Hypothesis: More visibility on informational topics increases branded demand later.
Setup: Choose one topic cluster that gained impressions. Track branded Search Console demand and direct visits over the next 2 to 6 weeks. Control for obvious confounders such as launches, PR, and paid brand campaigns.
Interpretation: If branded demand rises after non-brand visibility increases, that supports an attribution-loss explanation. If not, the added visibility may be low-value exposure.
3. Conversion quality on lower-click, higher-impression pages
Hypothesis: The users who still click from AI-shaped SERPs are more qualified.
Setup: Identify pages with materially lower clicks but stable or higher impressions. Compare before-and-after conversion rates for pricing-page visits, trials, demos, or lead quality.
Interpretation: If conversion rate improves meaningfully, the SERP may be filtering casual visitors before they click. If both volume and quality fall, the cannibalization case is stronger.
What this means for SEO strategy
When to keep investing in informational content
Keep investing when informational content clearly contributes to:
- branded demand
- owned audience growth
- stronger downstream cohort quality
- lower dependence on paid acquisition
- assisted pipeline
The case is not that traffic used to be higher. The case is that the content still creates measurable commercial influence.
When to shift toward commercial intent and audience capture
Shift resources when informational visibility rises and nothing downstream moves.
That usually looks like:
- no branded lift
- no return or direct lift
- no subscriber growth
- no improvement in trial or demo quality
- no pipeline effect
In those cases, commercial pages, comparison content, calculators, email capture, and product-led assets may deserve more budget.
How to explain this to leadership
The clearest version is:
Organic search no longer delivers all of its value as a click, so you should not evaluate all of its value as a click.
That is not a defensive argument. It is a measurement correction.
Traffic still matters. If clicks, cohorts, and revenue all decline, you have a real problem. But if sessions fall while intent and conversion quality improve, the conclusion is different.
Conclusion
AI Overviews did not just change click behavior. They changed what a good organic measurement system needs to measure.
The old KPI stack treated sessions as the main proof of SEO value. A better 2026–2027 model treats sessions as one signal within a broader system: visibility, intent, conversion, and cohort quality. That gives you a practical way to separate attribution loss from real demand loss.
If you change only one thing, change the unit of reporting. Stop asking whether organic produced a click. Start asking whether organic created qualified intent that turned into subscribers, trials, demos, pipeline, or revenue.
FAQ
Why are impressions rising while organic sessions fall?
AI-first search results can answer more of the query before the click. That means your pages may appear more often in search while fewer users need to visit immediately. The key question is whether those lost clicks reflect true demand loss or attribution loss that later appears through branded search, direct visits, trials, demos, or revenue.
What should replace sessions as the main organic KPI?
For most SaaS and lead-gen teams, sessions should become a diagnostic metric rather than the headline KPI. A better model tracks visibility metrics such as impressions and query coverage, intent metrics such as branded search lift, return visits, and signups, and conversion metrics such as trials, demo requests, pipeline, and revenue cohorts.
What is the difference between attribution loss and demand loss?
Attribution loss means search still influenced the customer, but the value is no longer fully credited to the original organic visit because the user returns later through another channel. Demand loss means the visibility produced little or no meaningful downstream action. That distinction is central to AI-era SEO reporting.
How can I measure organic impact if AI referrer data is incomplete?
Use a proxy model. Group pages into AI-assist cohorts based on informational query themes, rising impressions, or generative search visibility where available. Then compare those cohorts against control groups using downstream actions such as subscriber growth, trial starts, demo requests, return visits, and conversion quality over 7-, 30-, and 90-day windows.
What tools are enough for a lean measurement stack?
A lean team can do a lot with Google Analytics 4, Google Search Console, and server-side event handling through Google Tag Manager or a similar setup. The goal is not perfect attribution. It is durable event tracking, landing-page grouping, and cohort reporting that helps you judge whether organic visibility is creating qualified intent.
What are AI-assist landing pages?
AI-assist landing pages are pages you classify as likely to influence users inside AI-shaped search experiences even when direct click attribution is incomplete. In practice, these are often informational pages with rising impressions, broad query coverage, or visibility in generative search reporting, and they should be tracked separately from commercial-intent pages.
How do I estimate lost clicks versus gained intent?
Start with expected clicks based on historical CTR bands for a query or page group. Subtract actual clicks after SERP behavior changes to estimate the click gap. Then compare that gap against substitute signals such as branded search growth, direct traffic lift, assisted conversions, trial starts, or higher conversion rates from the users who still click. It will not prove causation, but it gives you a useful operating model.
What should be on a weekly AI-era organic dashboard?
A useful weekly dashboard has four core blocks: visibility, intent, conversion, and quality. Include impressions, query coverage, branded search lift, return visits, subscriber or trial cohorts, demo requests, pipeline contribution, and conversion rate by landing-page group. Add a short interpretation note covering what changed, likely causes, confidence level, and the next test.
How long should cohort windows be?
For many SaaS teams, 7-, 30-, and 90-day windows are a practical default. Short windows help spot early intent signals, while longer windows show whether informational visibility eventually turns into qualified pipeline or revenue. Businesses with longer sales cycles may need longer reporting windows.
When is informational content still worth the investment?
Keep investing when informational visibility correlates with stronger branded demand, more return traffic, better signup or trial volume, or improved downstream conversion quality. Reconsider it when impressions rise but there is no lift in intent, no movement in qualified actions, and no evidence of stronger pipeline efficiency.
How do I explain falling sessions to leadership without sounding defensive?
Frame the issue around decision quality, not traffic excuses. Explain that AI-shaped SERPs can reduce direct clicks while still influencing consideration and later conversion behavior. Then show a tighter reporting model that connects visibility to branded demand, assisted intent, cohorts, and revenue so leadership can judge business impact rather than react to a single declining metric.
What experiments can show whether AI visibility helps or cannibalizes revenue?
Start with three tests: compare AI-assist page cohorts against control pages on downstream conversions, measure whether branded search rises after informational visibility gains, and compare conversion quality for pages that lost clicks but gained impressions. The goal is not absolute proof. It is directional evidence that improves decision-making.
[^1]: Google Search Central announced Search Console generative AI performance reports on June 3, 2026, including dedicated visibility reporting for AI Overviews and AI Mode. [^2]: Google Search Console Help says the generative AI performance report includes impression data for AI Overviews and AI Mode and is being rolled out to a subset of properties. [^3]: Search Console documentation defines impressions, clicks, CTR, and position as core performance metrics for Google Search reporting. [^4]: Search Console documentation notes clicks are counted when the interaction leads out of Google Search, which helps explain why visibility and website visits can diverge. [^5]: Google has publicly argued that AI search experiences can drive more complex queries and higher-quality clicks; this is useful as vendor-reported directional evidence, not independent proof of business outcomes. [^6]: GA4 defines attribution as assigning credit across the user’s path to a meaningful action. [^7]: GA4’s User acquisition report is user-scoped for new users, while Traffic acquisition is session-scoped for new sessions. [^8]: Google Tag Manager documentation says server-side tagging provides an intermediary endpoint you control and allows screening, validation, and modification of data before sending it onward. [^9]: GA4 documentation says teams can create or modify events and mark them as key events without rebuilding site instrumentation, but those changes require a fresh measurement baseline rather than retroactive comparability.